FLOOD HAZARD ASSESSMENT AND CHANNEL
GEOMETRY:
WILLIAMSON CREEK
Prepared for:
Dr. Earl
Geography 4430
Southwest Texas State University
Prepared by:
Holly Mittel
And
Tonya Reese
April 18, 2002
Table of Contents
I. Background and Introduction
2
II. Approach
3
III. Description of Development
Site
3
IV. Description of Drainage Basin
4
V. Calculation of Peak Discharge - USGS Regression
Method
5
VI. Calculation of Peak Discharge - Rational
Method
6
VII. Time of Concentration
6
VIII. Field Analysis and
Verification
7
IX. Analysis
8
X. Conclusion
8
XI. References
9
Williamson Creek Flood Hazard
Assessment
and Channel Geometry
Background
South Austin is a heavily developed area and is
continuing to grow at an ever-increasing rate. Also, the
occupancy rates of apartments in the Austin area are at an all time
high, which has provided CNC Investments incentive to purchase and
develop one of the last empty plots in South Austin. CNC
Investments intends on building a 496-unit apartment complex on 34
acres of land between Manchaca Road and Westgate Lane. However,
the residential area northwest and downstream from the property are
already prone to flooding and now the Cherry Creek Neighborhood
Association fears a threat of increased flooding due to such
high-density development. At the request of the neighborhood
association, an environmental study is being conducted to assess the
hazards for the proposed site. Map 1 shows the current
undeveloped site and Map 2 shows the proposed development of that site
by CNC Investments.
Introduction
An essential component of any environmental study is
to determine if the flood hazard of the area will be increased due to
increased impervious cover. The purpose of this project was to
determine if such a high-density development would, if in fact,
increase the flood hazard of the surrounding neighborhood. A
tributary of Williamson Creek flows immediately adjacent to the
proposed site, which, less than one-fourth of mile away, meets up with
Williamson Creek. Many residents in the area have recently begun
to experience flooding problems, and the residents believe this is a
result of high-density development upstream.
The proposed site is also situated in close
proximity to the Balcones Escarpment. “Many large storms
and catastrophic floods have occurred along the Balcones
Escarpment. About a dozen storms with precipitation depths
exceeding fifteen inches in a few days or less have been documented in
this area in the past sixty years. These large storms can cause
some flood peaks which would exceed those that can be predicted
accurately by analysis of available precipitation data or flood
data” (Slade, Asquith, and Tasker 1995).
Approach
This was a task-oriented project, consisting mainly
of fieldwork and library research.
Fieldwork consisted of
· Locating the flotsam
· Measuring the stream channel width and depth
· Measuring the elevation and determining the slope
Library research included
· Locating the stream basin on a topographic map
· Delineating the Williamson Creek watershed
· Recording climate and soil data
The data was then analyzed and Soil Conservation (SCS) and U.S.
Geological Survey (USGS) empirical methods were used in order to
determine peak flood discharge and flood volume for Williamson Creek.
Description of
Development Site
The area of study is located in South Austin
at approximately 6000 Manchaca Road. It consists of 48+/- acres,
which are situated between Manchaca Road and Westgate Lane. The
property is currently undeveloped and is located in a primarily
residential area.
Description of Drainage Basin
Williamson Creek rises just west of Oak Hill in
southeast Travis County and runs southeast for eighteen miles, through
a variety of business and residential areas, to its mouth on Onion
Creek. Map 3 is a topographic map of the drainage basin for
reference. It crosses flat to rolling prairie surfaced by clay
and sandy loam that supports hardwoods, mesquite, cacti, and grasses
(Williamson Creek 2002).
Elevations
* Elevation at
outlet:
650 feet
* Highest elevation:
1,070 feet
*
Relief:
420 feet
Area of Basin
Ÿ Area with dot planimeter: 10,720
acres 4,340 hectares
Determination of Storm Magnitude*
Recurrence
Interval Storm
Intensity
(years)
(inches per hour)
2
2
5
2.5
10
2.9
25
3.4
50
3.9
100
4.2
*(Hershfield 1961)
Calculation of Peak Discharge
(USGS Regression Method*)
Length of Basin along Major Stream from Point of Measure to Drainage
Divide:
42,400 feet
Determination of Basin Shape Factor (SF):
SF = (stream length)2 / basin area
SF = (42,400)2 / 10,720 = 167,600
Determination of Stream Slope, in feet per mile:
Distance from point of measure to drainage divide:
7.0 miles
Difference in elevation between point of measure to
drainage divide:
Divide
Elevation:
1070 feet
Point of
Measure:
650 feet
Difference in
Elevation: 420 feet
Slope in feet/mile: Difference in Elevation /
Distance in miles:
420 ft. / 8 mi. = 52.5 feet/mile
Calculation of Peak Discharges:
Formula
Estimated Discharge (cfs)
Q2 =
252(17)0.721(167,600)-0.326
40
Q5 =
525(17)0.648
3,300
Q10 =
732(17)0.667
4,800
Q25 =
1034(17)0.685
7,200
Q50 =
408(17)0.768(52.5)0.281
11,000
Q100 =
416(17)0.788(52.5)0.325
14,000
*(Slade, Asquith, and Tasker 1995)
Calculation of Peak Discharge
(Rational Method)
Equation
Q = CIA
Q = Peak Discharge
C = Rational Runoff Coefficient = 0.70; residential and business
areas
I = 1 hour storm intensity in inches
A = Drainage basin area in acres
Calculation of Peak Discharge
Recurrence
Interval
Peak Discharge
(years)
(cfs)
2
15,000
5
18,800
10
21,800
25
25,500
50
29,000
100
31,500
Time of Concentration
T = Time in
concentration in hours
L = Basin
length in feet = 42,400 feet
H = Basin
relief in feet = 420 feet
Formula: T = L1.15 / (7770 * H.38)
Time =
2.7 hours or 162 minutes
Field Analysis and
Verification
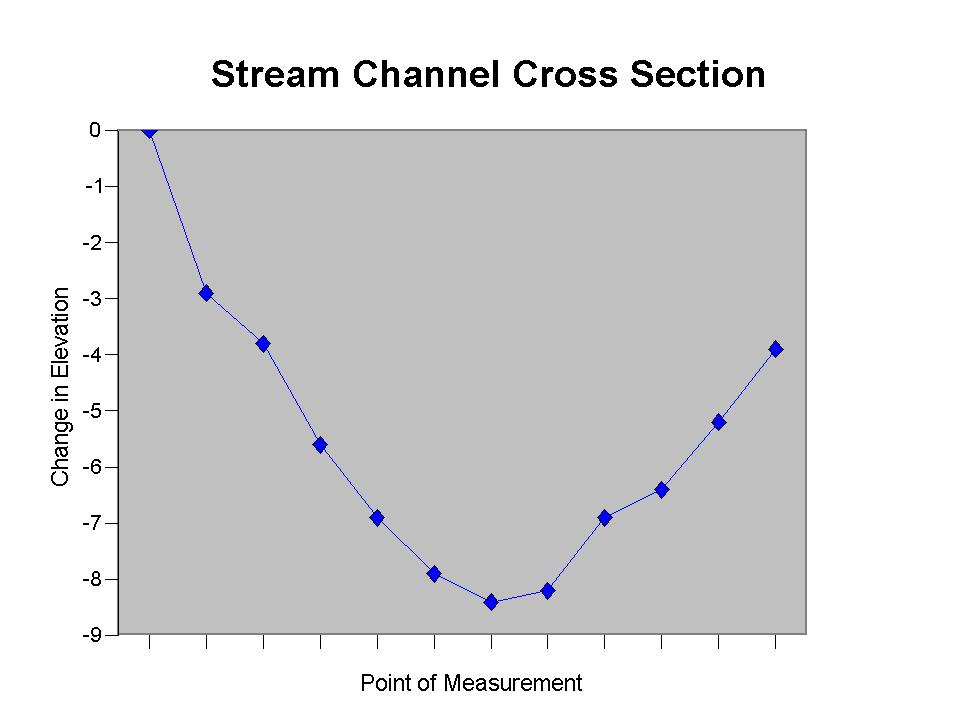
Estimated Channel Roughness:
n = 0.059
Calculated bankfull discharge by the USGS slope area
method:
W = 112 feet
D = 6.01 feet
A = w*d = 670 feet2
R =
A = 670 = 5.4 feet
2d +
w 124
S = 0.003
Qpeak = A(1.49)R0.67S0.05
N
Qpeak = (670)(1.49)(5.4) 0.67(0.003)0.5
0.054
Qpeak = 2900 cubic feet per second
Analysis
Calculated Discharge by Rational Method (cfs)
Slope Area
2yr
5yr
10yr
25yr
50yr 100yr
Cfs
10,720 15,000
18,800 21,800
25,500 29,000 31,500
% of S.A.
xxx
140% 175%
200% 240%
270% 290%
Calculated Discharge by the USGS Regression Method (cfs)
Slope Area
2yr
5yr
10yr
25yr
50yr 100yr
Cfs
10,720
40
3,300 4,800
7,200 11,000 14,000
% of S.A.
xxx
0.3%
31%
45%
67% 103%
131%
Conclusion
Based upon these calculations, the bankfull
discharge has a recurrence interval of about
1-2 years through the Rational Method and about 50 years through the
Regression Method. The neighborhoods surrounding this undeveloped
site along with the neighborhoods in the Williamson Creek watershed are
already experiencing flooding. Development of this plot of land
would increase the flooding in these neighborhoods due to the increase
of impervious cover. The small area set aside for recreation/park
area on the western edge of the property is not an adequate amount of
land to soak up the excess amount of water during a heavy rain.
The excess water will overflow the creek causing flooding on West Gate
Street, which is a major thorough fare for many motorists.